The Secret Language of Comics

What’s In My Bag?

In my backpack, there are eight items that I carry around with me. I counted the seven pens/highlighters as one item because they serve the same purpose. In the top right of the photo is a blue portfolio binder. I do not like using the generic binders because they are bulky and easily break. The portfolio binder keeps my class work and notes organized. This displays some sense of personality for me since I do like to be somewhat organized. I have a laptop as well, and it is the most important item I own because it is the tool for all my academics. The pens and highlighters are for note-taking, and I like to use various colored pens when taking notes to keep the notes organized and easy to read. Whenever I feel like reading, I would take a few minutes to read the “Self-Realization” book that is shown in the bottom left of the picture. There really is no explanation to the choice of book, a person I encountered at the airport gave it to me. Such a random book, yet I have learned a lot and it has been eye-opening. I have two chargers, one for my laptop and the other for my phone. My phone is always somehow on low-battery so I need to bring a phone charger everywhere I go. I also bring a pair of blue-light glasses with me. To be honest, I have reaped no observable benefits from the glasses but they look cool so I wear them anyways. Lastly, is a water bottle because I always stay hydrated no matter what.

The image of all the items in my bag is representative of certain aspects about me, but not representative of my personality as a whole. From the sheer lack of items in my bag, it illustrates the minimalistic side of me and that I tend to only bring and have things that I deem necessary. The portfolio binder reveals my liking of being organized. Lastly, the book, “Self-Realization”, about Krishna consciousness, displays open-mindedness and the sake of learning new things. When I took out my items from my bag to take a picture, I debated whether or not to include the “Self-Realization” book in there. I was slightly insecure about what others would think of me reading such an unusual topic that I feel like is not really covered in current society. Representing myself in a catalog of the stuff in my bag is a type of writing because it involves analyzing the items in my bag and how they reflect upon me as a person. Similar in reading a passage, analyzing the passage, and then writing about your analysis of the passage, representing yourself in a catalog of the stuff in your bag is also a type of writing.

Sunday Sketch 8 – Data viz from everyday life

For this Sunday assignment, I wanted to see the difference between days before my midterm and days after my midterm. The five categories that I chose are productivity, excitement, healthiness, tiredness, and quality of sleep. I tried not to be aware of my feelings and condition while I was gathering data, since I wanted to see the accurate result of my daily life.
After I made a graph, I could see the clear difference between days before and after the midterm. I was surprised that my tiredness level did not go down to 1 or 2 even after my midterm. Then, I realized that sleeping for a long time for one day after not sleeping enough for a few days does not make my daily condition right away. One more thing that surprised me was my productivity level on the day that I did not study at all. I learned that productivity level does not correlate to the amount of studying. However, I could see that the quality of sleep correlates to the amount of sleep, since there is a clear difference between days that I had enough sleep and 1-hour sleep. I think this is because I get too anxious even when I am sleeping because of my midterm. I found this assignment to be a valuable tool for self-analysis, since I could see my daily condition with my studying schedule in one graph. If I do continue this assignment in future, I want to focus on how I spend my days quantitatively.

Data Viz From Everyday Life

The concept I have chosen for this project was happiness. When analyzing how happy I am everyday, I identified five factors that would contribute to my happiness and wanted to see if those five were enough to determine how happy I was. The factors were time spent on phone, human interactions, productivity, stress, and exercise. Are these five categories enough to determine a broad level of happiness I was experiencing for the day?

After two weeks of data gathering, it can be concluded that there are far more factors that these five that determine happiness for me individually. The data is rather contradicting at times, one day I would have the complete opposite data of another day, but still end up having similar scores of happiness at the end of the day. However, according to the chart and data table, there seems to be a correlation between human interaction and happiness. The more I interact with people, the happier I am. When I stayed in my dorm room all day and barely contacted anybody, I felt lonely and in an overall bad mood. In order to score the five categories every day, I set up a 1-10 scale for each category. For example, for the productivity category, 1 would be no productive at all and 10 would be very productive. The judgment call I had to make using this scale was just exactly what score to give if I was just sort of productive and fell in between 1 and 10.

Before I started gathering the data, I wanted to know if having high scores in all categories would directly translate to a high score in happiness. That is why I used the graph above to visualize my data because it is very easy and simple to see the trends and correlations between the categories and happiness. These visualizations say that my life has a lot more factors that are tied into happiness outside of the five categories I chose to gather data on.

If I were to continue this project into the future, I would choose a different topic to measure instead of measuring happiness. I would choose a topic that does not have that many factors that influence the topic because it would make creating conclusions based on data and analyzing the data a easier. When attempting to analyze the data from this project I have done so far, it is hard to see how the categories influence happiness since there are so many other categories that effect happiness that I did not gather data on.

I have found this to be a valuable tool for self analysis since I am paying ore attention to my daily habits and actions more and looking deeper into what effects my emotions. From paying more attention to what makes me happy, I have come to the realization that going on my phone too much does not help with making me happy and if anything, puts me into a bored and dull mood.

Data Viz


For this Sunday Sketch, I focused on the number of assignments, hours spent on my phone, level of satisfaction of my day, quality of sleep, and hours spent doing something I like. I wanted to see how I spent my day and if I was satisfied with my productivity. I wanted to see the things I do unconsciously and what effect it has on my life. I have wanted for the longest time to evaluate if I am productive in my day and how I can implement healthy habits. Especially with the quarantine, I have been given so much time to figure out my workflow, and I have realized a few things. However, I have not taken out the time to do something like this assignment wanted me to do.

The weeks I chose to visual was the week after “rest” week and midterm week. I am not sure why, but after rest week, the first few days I was not getting quality sleep. I thrive off of sleeping. If I don’t sleep enough or have quality sleeps, it shows at least to me. At least, I was able to get somewhat quality during midterms. Before looking at the data visualized, I expected for the number of assignments and hours spent on my phone to be on opposite spectrums. It pretty much is except on Tuesdays and Thursdays. On those days, I have 3 classes, and it is the busiest days of the week. It is not what I was expected. For the first week, I was pretty satisfied with my days, and during midterms there is a little correlation with hours spent on phone and level of satisfaction. The more I am on my phone, the more satisfied I am. That makes sense but I am procrastinating more. Another variable is the hours I spent doing something I liked. I focused more on how much Netflix or Youtube I watch. Those are not the only things I like doing for myself, but they were easily measurable. I’m not surprised with the results for the things I like doing. Overall, I was not so shocked with this graph. It is nice to see this information is another perspective.

I liked the idea of this assignment, and I think I will try this out one more time. If I do it again, I want to focus on how I am feeling during different parts of the day. Focus more on my emotions rather than productivity. Afterwards, I could compare and really see how I am doing. Maybe, I could find out about certain things that stress me out without realizing. This method is a pretty cool way of self-analysis.

Data Viz / SK8


Assignment Link

For this Sunday Sketch, I focused on the number of assignments, hours spent on my phone, level of satisfaction of my day, quality of sleep, and hours spent doing something I like. I wanted to see how I spent my day and if I was satisfied with my productivity. I wanted to see the things I do unconsciously and what effect it has on my life. I have wanted for the longest time to evaluate if I am productive in my day and how I can implement healthy habits. Especially with the quarantine, I have been given so much time to figure out my workflow, and I have realized a few things. However, I have not taken out the time to do something like this assignment wanted me to do.

The weeks I chose to visual was the week after “rest” week and midterm week. I am not sure why, but after rest week, the first few days I was not getting quality sleep. I thrive off of sleeping. If I don’t sleep enough or have quality sleeps, it shows at least to me. At least, I was able to get somewhat quality during midterms. Before looking at the data visualized, I expected for the number of assignments and hours spent on my phone to be on opposite spectrums. It pretty much is except on Tuesdays and Thursdays. On those days, I have 3 classes, and it is the busiest days of the week. It is not what I was expected. For the first week, I was pretty satisfied with my days, and during midterms there is a little correlation with hours spent on phone and level of satisfaction. The more I am on my phone, the more satisfied I am. That makes sense but I am procrastinating more. Another variable is the hours I spent doing something I liked. I focused more on how much Netflix or Youtube I watch. Those are not the only things I like doing for myself, but they were easily measurable. I’m not surprised with the results for the things I like doing. Overall, I was not so shocked with this graph. It is nice to see this information is another perspective.

I liked the idea of this assignment, and I think I will try this out one more time. If I do it again, I want to focus on how I am feeling during different parts of the day. Focus more on my emotions rather than productivity. Afterwards, I could compare and really see how I am doing. Maybe, I could find out about certain things that stress me out without realizing. This method is a pretty cool way of self-analysis.


How Productive am I?

by Destiny Mascoll

For this Sunday sketch, I wanted to see how productive I was in the past two weeks of school. I decided to measure five things that I thought made me a productive student and family member. These two weeks were tough to push through despite the rest week, and it is apparent in the decline of hours spent on homework. The data also shows that the more I talked in my class zoom meetings, the less I procrastinated doing my work. This week I was not as productive as I wanted to be, but I am increasing my efforts to make it through the semester.
I chose to visualize my data through a chart because it felt like an accurate way to describe my week. If I could go back in time and redo the assignment, I would choose more categories because I think there are other factors I could have focused on. If I were to continue these visualizations, I would ask different questions to better understand how much I am doing in my life.

Data Reflection

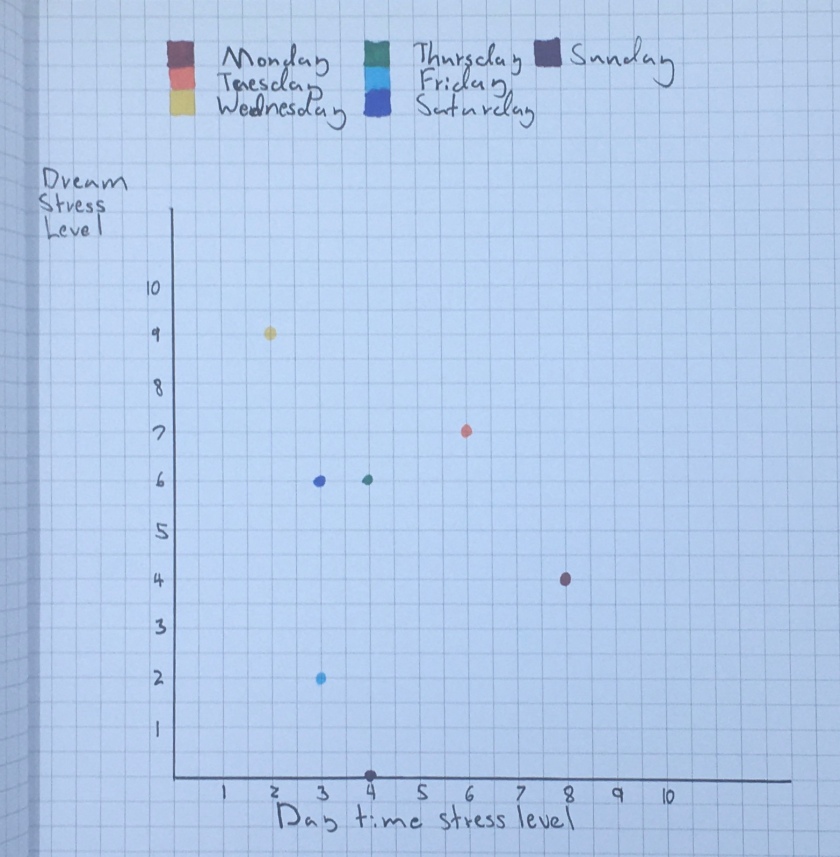
Recently, I have been dreaming a lot more often, and a lot more vividly. I don’t exactly know why, but going back on melatonin supplements might be to blame.Either way I have always been a pretty vivid dreamer. I remember my dreams most of the time and they tend to be rather interesting. Since we’re getting towards the end of the semester a lot of my classes have ramped up and I wanted to see how my varying day to day stresses affected how stressed out I was in my dreams. Coming up with my “hypothesis” I expected my results to be, pretty one to one. It makes sense, after all it is speculated that dreams are a way of brains dumping everything not needed out. However when I recorded my finding there wasn’t much correlation, and what little there is seems to be negative.

I pondered why this might be. I came to a couple conclusions. One is that I might not of been entirely honest with myself when judging my stress levels. Dreams are pretty easy since I wake up and can tell what I felt instantly from the dream, but it’s hard putting an entire 15 hour day in a single number. I probably am more stress than I care to admit. It could also be that since dreams are a way of your brain deleting everything you don’t need, it would make since that if you’re not stress your brain would dump out stressful things and vice versa. The one that really stuck out to me was Wednesday. I don’t want to detail the dream but it was truly upsetting and woke me up way before I needed to be awake. I think it just formed from a cumulation of stress gathered over the past year just washing up all the sudden.

Sunday Sketch 8: Daily Productivity Visualized

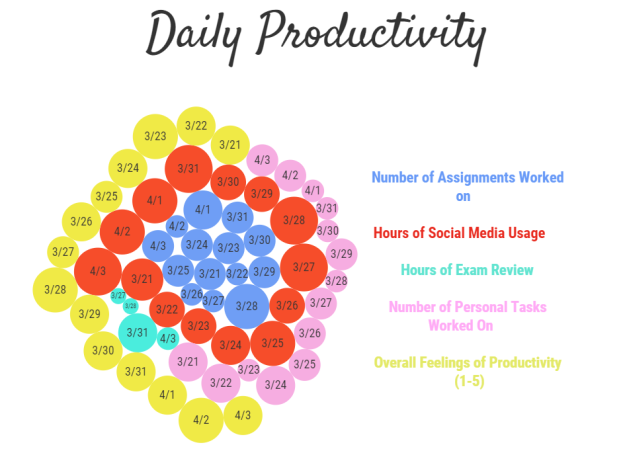
Daily productivity shown as a bubble cloud

The two main questions I tracked for this sketch were “Throughout the week, how productive am I?” and “How is productivity defined?”. By the end of the tracking period, I would say I successfully answered both of my questions. I was not surprised to learn how irregular my productivity is each week. Some days I get a lot accomplished and other days not so much. I was also not surprised by the absence of exam review hours in the cloud. It is something that I plan to do everyday however I rarely get around to it. It was embarrassing to see how many big bubbles of social media usage are present in the cloud. Prior to this project, I knew I used it a lot but it was scary to see how much of my day is eaten up by social media. On days that I had fewer classes, towards the end of the week and the weekend, I tended to have a spike in hours of social media usage which is understandable. Although I could be using this time to make up for the lack of exam review or finishing assignments, I use social media as a form of self-care and procrastination.

One thing that did surprise me is that I was productive every single day. There was not one day that I did not do something or that I didn’t feel at least a little productive. I was always working on an assignment or personal tasks. This plays into my other central question of the definition of productivity. There are a lot of mainstream definitions that highlight getting school or work related tasks done. However, I think everyone has differing definitions of productivity. Personally, I believe productivity does revolve around school and work related activities but, it also includes personal tasks such as extracurriculars, housekeeping/errands, or self-care practices. By this definition, I was very productive everyday because in most, if not all cases, I did a large combination of school work and other personal tasks. It was important for me to make this designation because I often beat myself up over not being “productive” enough despite actually being very productive based on my own definition. It’s important to acknowledge that mainstream productivity is one sided and doesn’t account for a large array of other tasks. People may look down on others who don’t study for long periods of time but they don’t consider the other huge priorities and commitments that make up a persons day outside of studying.

I chose to use a bubble cloud because I wanted a creative representation of categorical comparison. The first design that came to mind was a stacked bar graph. It was simple and I wanted something that most people wouldn’t think to use. I researched good methods of comparing across categories and bubble diagrams were suggested. The cloud makes it more visually appealing and I am able to see the inconsistencies in the crowd (small amount of bubbles or abnormally huge bubbles). I enjoyed this project because it helped remind me of my unique productivity in a current time that pushes constant productivity through studying and staying on top of the mountains of assignments assigned each day. It’s also really important for me to analyze my productivity in the hopes that I can make changes to my routine to tailor it so that I am more or less productive while maintaining my overall personal health.

css.php