The Secret Language of Comics

Data Reflection

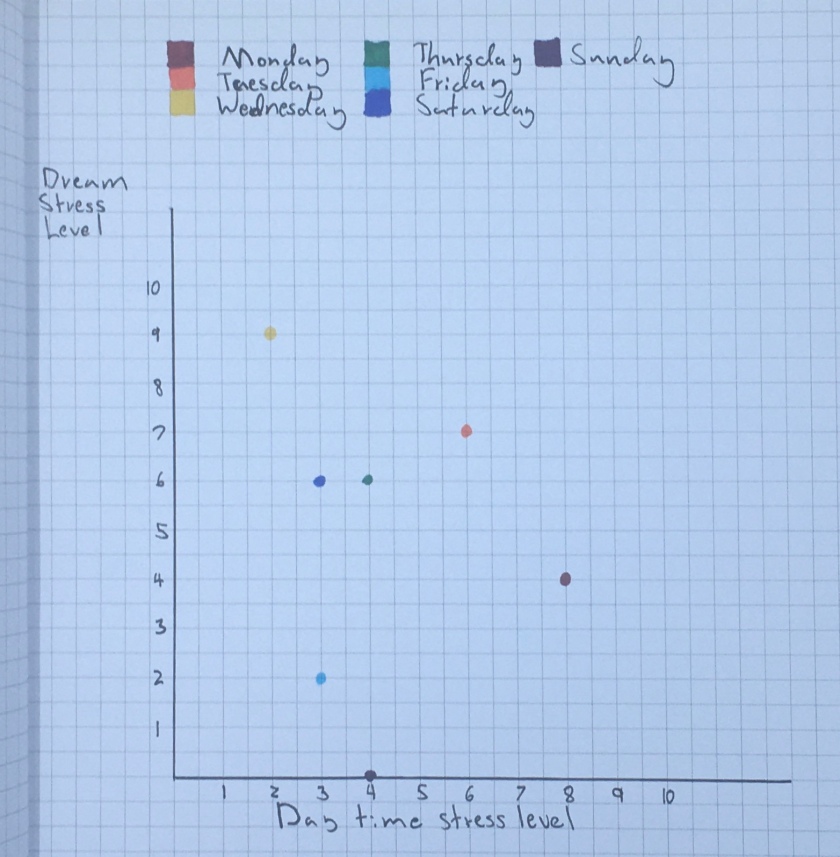
Recently, I have been dreaming a lot more often, and a lot more vividly. I don’t exactly know why, but going back on melatonin supplements might be to blame.Either way I have always been a pretty vivid dreamer. I remember my dreams most of the time and they tend to be rather interesting. Since we’re getting towards the end of the semester a lot of my classes have ramped up and I wanted to see how my varying day to day stresses affected how stressed out I was in my dreams. Coming up with my “hypothesis” I expected my results to be, pretty one to one. It makes sense, after all it is speculated that dreams are a way of brains dumping everything not needed out. However when I recorded my finding there wasn’t much correlation, and what little there is seems to be negative.

I pondered why this might be. I came to a couple conclusions. One is that I might not of been entirely honest with myself when judging my stress levels. Dreams are pretty easy since I wake up and can tell what I felt instantly from the dream, but it’s hard putting an entire 15 hour day in a single number. I probably am more stress than I care to admit. It could also be that since dreams are a way of your brain deleting everything you don’t need, it would make since that if you’re not stress your brain would dump out stressful things and vice versa. The one that really stuck out to me was Wednesday. I don’t want to detail the dream but it was truly upsetting and woke me up way before I needed to be awake. I think it just formed from a cumulation of stress gathered over the past year just washing up all the sudden.
Sunday Sketch 8: Daily Productivity Visualized

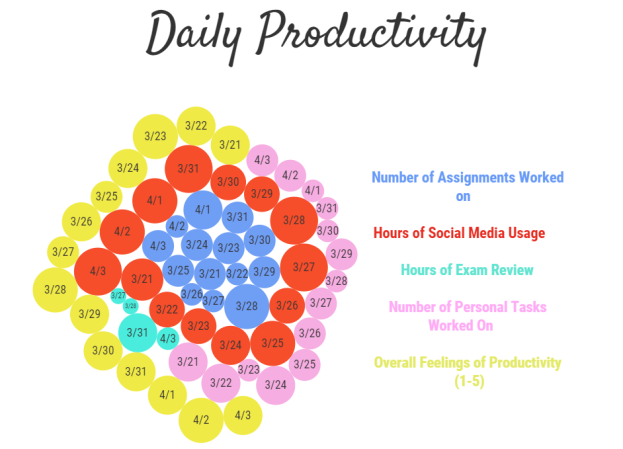
Daily productivity shown as a bubble cloud

The two main questions I tracked for this sketch were “Throughout the week, how productive am I?” and “How is productivity defined?”. By the end of the tracking period, I would say I successfully answered both of my questions. I was not surprised to learn how irregular my productivity is each week. Some days I get a lot accomplished and other days not so much. I was also not surprised by the absence of exam review hours in the cloud. It is something that I plan to do everyday however I rarely get around to it. It was embarrassing to see how many big bubbles of social media usage are present in the cloud. Prior to this project, I knew I used it a lot but it was scary to see how much of my day is eaten up by social media. On days that I had fewer classes, towards the end of the week and the weekend, I tended to have a spike in hours of social media usage which is understandable. Although I could be using this time to make up for the lack of exam review or finishing assignments, I use social media as a form of self-care and procrastination.

One thing that did surprise me is that I was productive every single day. There was not one day that I did not do something or that I didn’t feel at least a little productive. I was always working on an assignment or personal tasks. This plays into my other central question of the definition of productivity. There are a lot of mainstream definitions that highlight getting school or work related tasks done. However, I think everyone has differing definitions of productivity. Personally, I believe productivity does revolve around school and work related activities but, it also includes personal tasks such as extracurriculars, housekeeping/errands, or self-care practices. By this definition, I was very productive everyday because in most, if not all cases, I did a large combination of school work and other personal tasks. It was important for me to make this designation because I often beat myself up over not being “productive” enough despite actually being very productive based on my own definition. It’s important to acknowledge that mainstream productivity is one sided and doesn’t account for a large array of other tasks. People may look down on others who don’t study for long periods of time but they don’t consider the other huge priorities and commitments that make up a persons day outside of studying.

I chose to use a bubble cloud because I wanted a creative representation of categorical comparison. The first design that came to mind was a stacked bar graph. It was simple and I wanted something that most people wouldn’t think to use. I researched good methods of comparing across categories and bubble diagrams were suggested. The cloud makes it more visually appealing and I am able to see the inconsistencies in the crowd (small amount of bubbles or abnormally huge bubbles). I enjoyed this project because it helped remind me of my unique productivity in a current time that pushes constant productivity through studying and staying on top of the mountains of assignments assigned each day. It’s also really important for me to analyze my productivity in the hopes that I can make changes to my routine to tailor it so that I am more or less productive while maintaining my overall personal health.

Data viz of Excitement and Productivity

For this Sunday Sketch, on a scale of 1-10, I decided to track the five categories: Productivity, Creativity, Excitement, Zen, and Fun. The main reason why I chose these categories is because I wanted to see how my emotions impacted my ability to complete work. I chose to display my data as line graph was to see if there was any correlation between any of the categories. I found that there are some relationships. One example would be the relationship between excitement and fun. On 3/18 and 3/19 I had excitement levels of 8 and 9, respectively, because I was excited to see someone I had not seen in a long time. I saw that person on 3/20, and we did many fun things. That was why my fun level for the day was a 9. Another interesting relationship is between excitement/fun and Zen. 3/22 was a Monday, and I have four classes on Monday, which is definitely a cause of stress. Therefore, on Mondays, I rarely feel calm and my zen level was rather low.

From this ten-day trial, I believe that my emotional state does not have a strong impact on my productivity and creativity. I believe this because there is no correlation between any emotionally based category (excitement, Zen, and fun) and productivity related category (productivity and creativity). If I were to do this project again, I would not change much. If I were to change something, I maybe would be stricter on how I ranked each category each day to give the data more variance. The data for each day will never be perfect because there are so many extra variables to take in account. One example is the amount of work I actually have each day. If I only have one assignment to complete, and I completed then I would think I was rather productive. However, if I have multiple assignments and fail to complete one, I would not consider my day as productive even though I probably did more work.   A change I would make to the data gathering would be to make it even more strict. I think if I had more variance in the data, I would be able to see more defined relationships between the categories. I thought this assignment was especially useful tool because able to analyze trends that are occurring in my life. I am happy to know that my excitement and fun levels are not affecting my productivity.

Sketch 8: Data Viz From Everyday Life

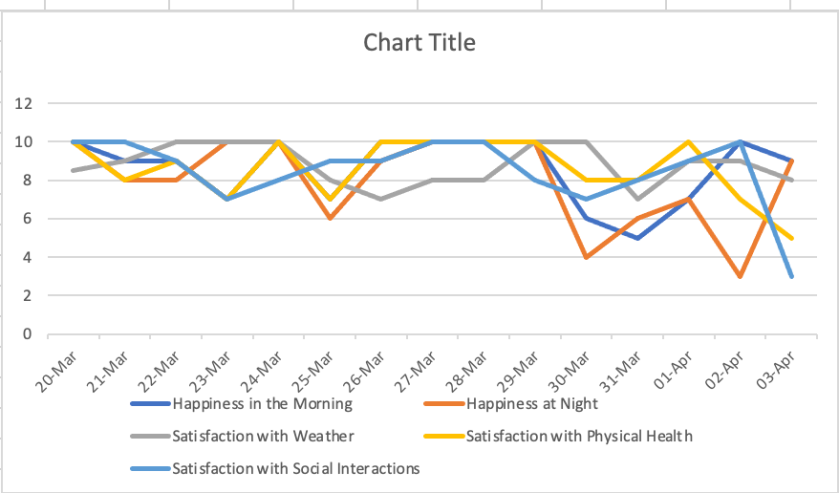
Over the course of this data collection, I wanted to begin to answer how much my schoolwork and life habits affect my overall “satisfaction”/happiness between the morning and the end of the night. I am able to conclude that my mood on Tuesdays and Thursdays are worse than other days of the week because most of my classes are on those days and most of my responsibilities are also on that day. (club meetings, internship meetings, homework due). There is a big drop between april 2nd and the third because I tested positive for COVID and had to go to the hotel for isolation. I dont think I am fully able to answer that question with these data points but it does give me an idea of how my daily habits and the weather affects my mood. To make sure I was able to make accurate measurements of my mood/satisfaction, I set aside 2 minutes to clear my mind before I do my ratings so that I can make a more accurate reflection of my personal mood. These visualizations really showed me that I need to be more careful on tuesdays and thursdays to avoid being burnt out. I think this was a valuable tool for self analysis if I added more variables towards my survey

Data Viz from Everyday Life

I tracked 5 areas of my daily life: stress/human interaction/accomplishment/satisfactory levels and time spent on laptop, to form a graph measuring my overall productivity level. From the graph, I can analyze my overall productivity level, and see what events in my life impacted my productivity. When I was first brainstorming about my data, I was unsure about what to track. Then I focused on a concept that I wanted to analyze for myself, which was productivity. I spent some time thinking about what contributes to my overall productivity, and I came up with the 5 areas.

When looking at the 5 areas, I can see that they are impacted by the events in my life. For example, my birthday was March 28, and unfortunately I had a lot of work to finish that week since my birthday was on Sunday. Therefore, you can see from the graph that the days leading up to March 28, from 21-26, my overall stress level and time spent on laptop increased as I was finishing all my work before my birthday. You could also see my human interaction, satisfactory, and accomplishment levels increased from 27-28 while my other levels decreased. This is because I finished all my work, and spent more time socializing since it was my birthday. Another event that impacted the 5 areas is my bio midterm on April 2. Clearly, on the graph, my stress level went up because I have a midterm that day, but my accomplishment and satisfactory levels also went up because I did well on my midterm. The day after my bio midterm, everything went down because I finished all my work, except my human interactions level because I socialized more.

Overall, from my data graph, I can see that my everyday productivity levels depend heavily on the events or assignments that I have that day. If I were to do this in the future, I would focus on a different category, because productivity is easily affected by other aspects of my life. I would rather do happiness or positivity levels. I also think that if I do this long term, I can discover factors influencing my life that I never knew before.

Literacy Narrative Part 3 Reflection

After completing the entire process of the literacy narrative, it—first and foremost—feels relieving but also I have definitely gained a new insight on the writing process and helped me meet the learning outcomes for this class.

By first writing the alphabetic literacy narrative, I created the foundational “script” to then craft my comic. When I was writing my alphabetic narrative I was mainly focused on writing in the most descriptive way possible without going overboard either. However, once I was crafting my comic I became more concerned with what parts of my alphabetic narrative I should transcribe into a visual representation in addition to textual information and how to do so in a manner that the narrative would remain clear for my audience. When drafting the format of my comic, I looked back at the past readings we have done to see how the authors implemented their choices of moment, image, word, and such as Scott McCloud represented them in his Making Comics text.

This entire literacy narrative project really emphasized the concept of the writing process being long and including multiple revisions and drafts. I made at least two drafts for Part 1 and it still felt rough; I roughly sketched out a couple different possibilities for the format of my pages; I went back to Part 1 and sort of completely redrafted it, changing the organization and adding some details. After having worked in the visual medium then returning to a text narrative, it’s what helped me reorganize my timeline as well as encouraging me to use photos in my post that also added to the narrative as it’s being read. That being said, while my comic is definitely full of more visuals than this final copy of my literacy narrative, I think I do fall short in some of the visuals in my comic simply because I don’t have such high artistic skills. Having worked in the visual medium before returning to text once again made me think of more ways in which I could be more descriptive—areas in which I thought my comic’s visuals themselves lacked detail.

Literacy Narrative 3 Reflection

Creating all three literacy narratives helped me to meet the Learning Outcomes of this class. Through this project, I could compose texts both visually and alphabetically. Also, I could learn some strategies of revision, editing, and reflection. Having revised the essay three times and received feedbacks of each text, my thinking process and writing skill have improved. After each of my literacy narrative was published, I had to critically think about the ways that can improve my work. I could feel that my reflection posts were improving, in the sense of writing more about my feeling, not just describing the process. Having created the comic helped me writing my alphabetic literacy narrative a lot. The big change that I have made compared to the literacy narrative 1 is deleting one of my central topics. My first literacy narrative had two central topics in it, but I only focused on one topic for literacy narrative 3. While I was creating the comic, I learned that I should not have unnecessary parts. It sounds pretty obvious, but I did not know that my first literacy narrative has that many worthless parts until I started working on my comic. After I deleted all the unnecessary paragraphs, I could write more about my feelings and the details of the progression of my experience. Also, I could incorporate visual thinking into my writing process and changed the way that I work on writing.

Literacy Narrative 3

Literacy Narrative 3 Reflection

This project definitely did help me a lot in understanding of the goals for this class. Before this class “comics” and “books” held entirely different spots in my head but now I realize more than ever how visualizing a text can help someone come to understand it. It was fun being on the other side of the page and trying to figure out how to express what I had in mind and how exactly to format it. 

Having to draw what I had already written was an interesting experience. I had to condense down what I was trying to convey, since with comics you just don’t have as many words. Looking between my first and final written draft it’s pretty clear that my final is more concise and focused than the first. My first draft I felt compelled to tell my entire life story and how I had struggled with writing. It focused a lot on my experience with my fourth grade class. When it came time to actually draw it as a comic though, I found that having 2/4 pages be just the fourth grade was well, boring. So I kept it briefed and moved on. I think that really helped a lot going back to literacy narrative since I was able to focus more on how it affected me rather than why it affected me.

Literacy Narrative Part 3 Reflection

The literacy narrative project has definitely helped me meet some of the learning objectives for this class. By portraying my literacy journey in both written and comic form, I expressed the same story in different mediums. Before creating the comic, I read multiple essays by Hillary Chute and Scott McCloud and synthesized their ideas to make my own comic. Additionally, by writing two versions of my written narrative, I effectively edited and revised my written narrative.

After creating my comic, returning to my written narrative was definitely unsettling because I decided to change some of key elements of my story. Perhaps, the biggest alteration was when I decided to change the opening my narrative. Initially, in Literary narrative part 1, I started my literacy journey in 8th grade when I struggled to read To Kill a Mockingbird. However, in my comic, I decided to scrap that idea and start in 6th grade when I failed a pop reading quiz. The main reason why I decided to make this change was because failing my pop quiz was a single event, which, therefore, was more story like. I thought this change would favor the visual format. Additionally, I thought this memory was more resonant in my mind, and more accurately showed my past sentiment pertaining to reading and writing. After creating my comic, I realized that my story was truly unique to me, and I needed to reflect that in my writing. Therefore, throughout the whole piece, I tried to more explicitly show my thoughts.

When first turning my narrative into a visual comic, my goal was to take key events of my comic and accurately portray them with images. In other words, my thinking process was one of showing not telling. When making some illustrations from memory, I had thought of some details that I did not even think to put in my writing. For example, while making my comic, I remembered what my Indian Camp essay was about. I first illustrated base of my essay in my comic and then decided to include it in my revised version of my written narrative. As a whole, when rewriting my narrative, I wanted my writing to more represent my comic than be a simple revision. Therefore, upon editing, I tried to make my narrative more story-like and personal. By analyzing my own comic, I believe I effectively did this.

Literacy Narrative Pt. 3

Lit Nav. Pt. 3 Reflection


Link to Pt.3

Compared to the part one, this narrative is very to the point. In the first essay, I mentioned other events that experienced my way of writing and reading, but they don’t have the same impact as the ones in this essay. Because of the comic coming in between the essays, it made me reevaluate which events are truly necessary to the essay and which ones I can leave aside. The comic really made me look at things in a different way. I would be like “would I draw that in my comic” to figure out if I should include something. I do have to say that I revised my very first essay after visiting the writing center. The writing center advised me to write as though I am playing Minecraft which was an amazing idea. That helped me bring everything together. As each assignment passed, the story got more concise.

Overall, this whole process was fun and out of the box. I enjoyed playing with different elements. Out of all 3 parts, I loved creating the comic the most. It was interesting putting words into drawing to make a story.

css.php